A poll of two halves
(Adding up to a whole lot of nonsense)
Denis Donoghue
12/15/20237 min read


Since the publication in November of the latest Ipsos UK poll commissioned by STV, there has been intensive and extensive chat about the whole issue of polls and polling. Many unionists claim that Ipsos are biased towards Yes, funded by the Scottish Government and weight their polls in favour of Yes. Of course, none of these allegations are remotely true. But that doesn’t stop them throwing mud in the hope that some of it sticks.
The issue of polling is very important and also highly contested. This is because (in the absence of any clear route towards a referendum) many commentators on both sides cite opinion polling as an important barometer of the public appetite for independence. I have seen and heard several references to a consistent series of polls showing 60% support for independence as being one route to pressuring the UK Government to “allow” a referendum.
So, the quality and veracity of polling should be something that Yes campaigners in particular should be focusing on much more aggressively. Some polls that are given equal credibility in the media are quite frankly laughable, while others are conducted to a very high standard by organisations with long-standing expertise and experience.
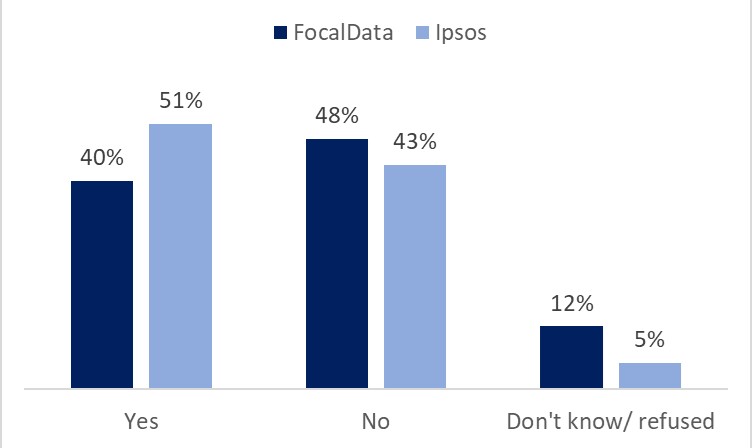
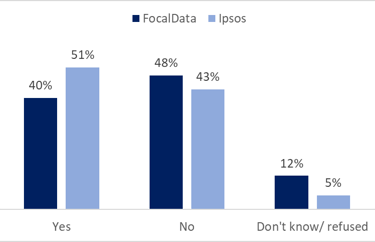
In this blog I’m going to compare two recent polls, one conducted by FocalData for These Islands, and the other being that Ipsos poll commissioned by STV news. As you’ll see below, the FocalData one has an eight-point lead for No, while the Ipsos one has an eight-point lead for Yes.
To understand why there are so many differences between these two polls we need to look at several component parts of political polls that are all important:
Sampling and survey approach;
Placing and wording of questions;
Data checking and validation;
Weighting; and
Turnout adjustment
Ipsos UK, formerly Ipsos MORI, is part of one of the largest public opinion polling groups in Europe. Ipsos was founded in France in 1975 and has subsequently expanded across much of Europe and in the USA. It merged with MORI in 2005. MORI was founded in 1969 by renowned pollster Sir Robert Worcester and was an established polling company in the UK in every General Election between 1979 and 2005. Ipsos is now the only major pollster regularly using CATI (Computer Aided Telephone Interviewing) to conduct its political polls. It’s an expensive approach but provides numerous advantages in that interviewers can probe, challenge and check responses. For example, the CATI technology would have enabled an Ipsos interviewer to challenge someone who claimed to be aged under 25 and yet had voted in the 2014 referendum. Either they were lying about their age, or about voting in 2014.
Focaldata was launched in 2020 and brands itself as the only research firm that’s cracked the tech/ people code (whatever that means!). It states that:
“an imperfect understanding of people is the root cause of fundamental social, political, environmental and economic problems — from low growth to inequality.”
Focal Data use a panel approach, where they send out surveys to a large number of people who they have specifically recruited. Unfortunately, we don’t know much about how they go about recruiting panel members.
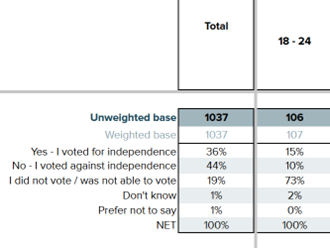
Oddly, the FocalData poll hasn’t quite cracked the knack of validating findings, because 25% of its 18 to 24 year olds claim to have voted in 2014. Since the Independence referendum was held more than nine years before the poll, the oldest anyone in that category could have been is 15. Similarly, 31% of that age group identified having had a vote in the 2016 Brexit referendum (where the franchise was 18+). The oldest anyone in that category could have been for that vote was 17. I smell a rat!
This would normally have rung alarm bells with the Research Manager who commissioned the poll. Such glaring errors in the sample would suggest a lack of robust processes at either the panel recruitment, survey recording or sampling stage. So, either they did not check the data, or they are aware it is flawed but did not challenge the polling company.
If these youngsters seem a little old before their time, wait until you see their voting intentions. Apparently 6% would vote for Reform UK while only 4% would vote for the Scottish Greens in a Westminster election. According to this poll, under 25s are more likely to vote for Reform UK than over 65s. That just isn’t credible.
In theory the British Polling Council should be policing some kind of minimum standards in polling. But their role in ensuring data quality does not go beyond ensuring that data tables are published. The Market Research Society (MRS) provides a more thorough set of standards and a Code of Conduct for members. FocalData is a member of the MRS so should be providing a higher standard of quality in its polls.
I would also expect Professor John Curtice’s What Scotland Thinks website to apply a little more quality control in its poll aggregation. But that site gives equal weight to these polls despite their clear flaws.
Setting aside these obvious inadequacies with the sample, let’s look at the questions. Let’s remember that this poll has been commissioned by unionist lobby group: These Islands, and that FocalData do not have an established method or track record in #Indyref polling. These Islands have persisted with the frankly idiotic approach of asking about independence using the Leave/ Remain categories as well as the standard 2014 question. That is such an obviously flawed approach to measuring support for independence that I’m not going to waste my time rubbishing it. But because they wanted to compare both question types they split the sample in half. Half of the sample were asked the normal Independence question first and the Leave/ remain one after, and the other half vice versa.
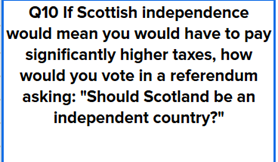
So, to get the full picture of #Indyref voting intention, we need to add together the two halves of the sample. But… in the middle of these two halves of the #Indyref question are two very one-sided questions (numbered 10 and 11).

These two questions serve to highlight potential negative consequences of Scottish Independence (as often wheeled out by unionists). If these were balanced up by similar questions looking at the positive consequences that would be slightly more reasonable – but there are no such questions published in the data tables. These would also be less harmful if asked after the main #Indyref question itself; so as not to influence responses to that. But this only happened for half of the sample.
Leading or influencing questions are a complete no-no in the world of social research and are frowned upon by most reputable pollsters. Here’s what Yougov’s Director of Political Analytics Patrick English had to say about this kind of question:


"A crude example of a leading question might be “To what extent do you believe that this current corrupt Conservative government is doing a bad job?”, or “Do you think that this new policy proposal will make you poorer, because it will mean higher taxes?”.
Neither of these would be considered acceptable measurements of public opinion. Instead, they would massively overinflate the extent to which people, or the public, actually hold those respective position by not presenting the options (or the debate) fairly."
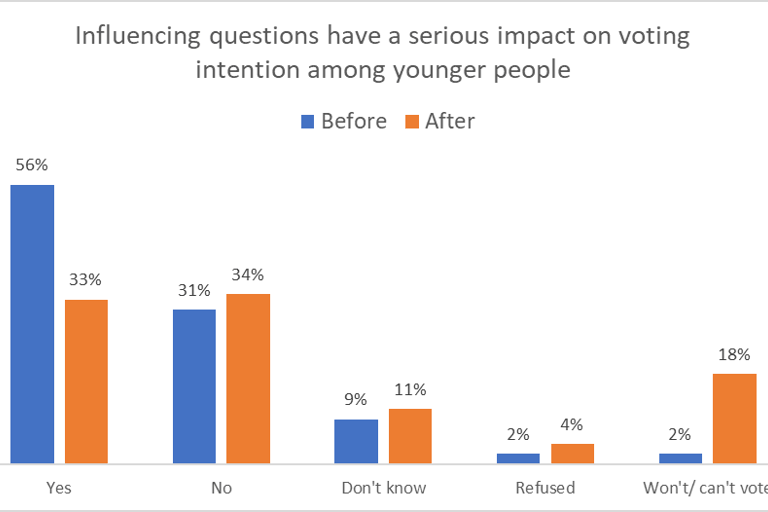
So, what does it matter, it’s not going to make much of a difference, eh? So’ let’s see what impact the placing of these negatively influencing questions had on the two halves of the sample. Below are the responses among the Under 25s in the sample, split by whether they were asked the #Indyref question before Questions 10 and 11 or afterwards. You can see that the Yes support drops significantly, from 56% to 33%. There is a slight increase in the support for No, Don't Knows and Refused to answer but a significant rise in and those who say they won't or can't vote!
Under 25s generally have the highest level of support for independence; for example it was 71% in the recent Ipsos poll. These Islands have independence support among under 25s at just 45% in this poll!
You will also notice that FocalData do not filter the responses based on likely turnout, which is why the figures include some that say they won't vote and a higher proportion of Don't Knows. We know that the turnout in the #Indyref was around 85%, so it's relatively easy to add a question that allows you to identify the 85% of respondents who are most likely to vote; or at the very least to remove from the reporting those who say they definitely won't vote. Ipsos have a well-established weighting for turnout which provides a figure almost identical to the 2014 referendum turnout.
And as a Post-script to that, the Wikipedia page on Indyref Polling has misrepresented the poll I commissioned in September by reporting the figures unweighted by turnout. Again, Find Out Now (like Ipsos) used a likelihood to vote question so that the results would be reported more accurately. Why would you report the views of people who have literally told you they are 100% not going to vote?
So, to summarise the issues with the These Islands poll:
The sample is flawed because the data has not been checked or validated effectively;
The sample is weighted by 2014 vote, with the % of No voters bumped up at the expense of new voters;
The Indyref questions are split, with half of respondents subjected to leading questions before being asked about their referendum choice;
The data is not weighted for likely turnout.
All of these issues are likely to influence the voting figures against independence support. Do you really think it's fair to give equal weight to such poorly constructed and badly analysed polls?