Lifting the lid on the black box
A closer look at how polls work
7/6/20236 min read


We place a great deal of emphasis on polling. It provides the media, politicians and the wider public with what they think is the accepted view of the electorate. For example, when we talk about a 'settled will' or a 'divided nation', the evidence for these assertions is based on what the polls tell us. And for the Scottish independence campaign, there is often talk of reaching the magical figure of 60% support to demonstrate a sustained backing for constitutional change. But the polls are often wildly contradictory, with a five point No lead one week changing to a five point Yes lead the next. Why is there such variability in the polling? And what are the key factors that influence what polls tell us? In this short blog post I will try to explain some of these anomalies and what factors might influence the findings of independence polls.
First question, starting with the basics, what is a poll? A poll is in essence a sounding of a particular population (usually the electorate) on a particular topic. It aims to provide us with a reliable picture of the views of that population on the topic. But to be reliable the polling sample needs to be representative of the population being surveyed. There are two factors to consider here; size of the sample, and the characteristics of the individuals that make up the sample. Looking at size firstly, the number of people 16+ registered to vote in Scotland was around 4.25 million in December 2022. So how many people do we need to survey to get an accurate picture of such a large population? Clearly, the larger the sample size you can survey, the more accurate the results will be. But in practical terms most people don't have the resources or time to conduct large scale population surveys. The compromise is to survey a smaller number of people from your population, but to 'weight' the sample to be representative of the wider population.
When using subsets of the overall population there will always be a margin of error. This is a statistical feature which provides an estimate of how accurate your results will be. The smaller the sample size, the greater the margin of error will be. So, if your sample size has a margin of error of 5%, and tells you that 52% of voters support independence; then you can assume the actual figure is somewhere between 47% and 57%. This shows that when you have a population that appears to be evenly divided on a subject, margin of error can be very important. With that margin of error, we couldn't be confident that there was a majority support for independence in the wider population. Another factor is confidence level, which is essentially how confident you can be that the results will be within the margin of error. Usually 95% is the accepted level of confidence. Once you decide on what the acceptable margins of error and confidence intervals are, there is a complex formula you can use to determine the minimum sample size you need. Luckily there are also various online calculators that do the calculations for you, such as this one.
So, for the 4.25 million Scottish electorate, if we can tolerate a 3% margin of error and 95% confidence level, we need a sample size of 1,067. But if we wanted to squeeze down the margin of error to just 1%, we'd need a much larger sample of 9,582. So, polling samples generally compromise some level of accuracy for practicality around size. Most Scottish Independence polls have sample sizes of around 1,000.
So far, so straightforward? Well, the next thing to consider is the randomness of the sample. By that I mean, how have you contacted the individual being surveyed, and how do we know that the sample is representative of the wider population? The two main methods of survey polling are panels and telephone surveys. The vast majority of political polls today are carried out through panels: it's much more cost-effective and provides quicker results. IpsosMori are the only major polling company who still carry out telephone polling. Neither of these approaches will give you a completely random sample. Panels are where polling companies pay people to answer questions; which requires a certain level of engagement on the part of the panel members. Telephone surveys depend on people having a phone and being around (and willing to answer) when the polling company calls. To counteract the issues of samples not being representative, pollsters either weight the responses so that they match the wider population or oversample to allow them to choose a representative sample from the wider number surveyed. To my knowledge, Find Out Now are the only major pollster to use this latter approach. So, in the poll I recently commissioned, they surveyed 5,300 people and selected a representative sample of 1,249 from within this that reflected the wider population. In theory, this is a more robust approach, as the sample (once selected) doesn't need artificial weighting. Although it is presumably more resource-intensive in terms of data collection.
The more common approach is to weight the sample to reflect various wider population characteristics. Generally these include demographic aspects (age, gender, socio-economic group etc.) and political elements such as past voting patterns. There has been a lot of debate about whether or not Indyref polls should be weighted based on the 2014 result or not. That debate will warrant a post of its own, but some level of political weighting helps to make sure samples aren't skewed towards one side or another. To give an example of how weighting works, Survation uses a panel approach and usually surveys around 1,000 individuals. To weight based on the 2014 vote they need to identify the proportion who voted Yes, those who voted No and those who did not vote.
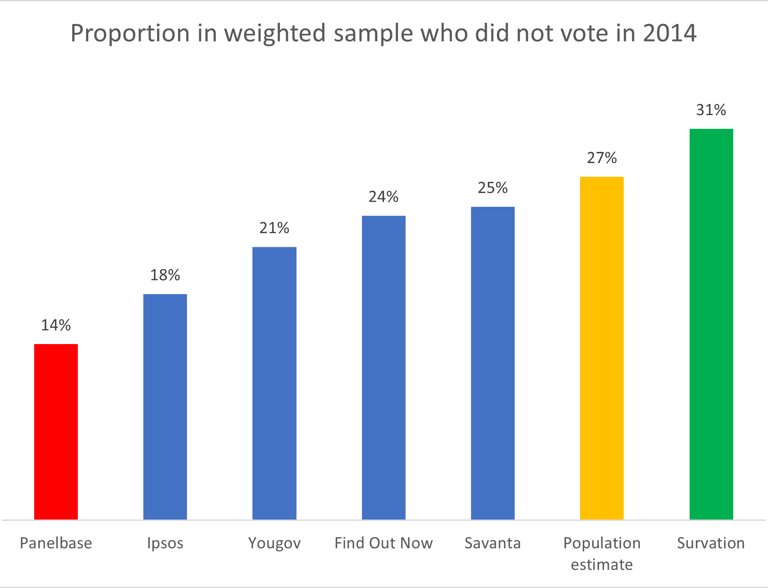
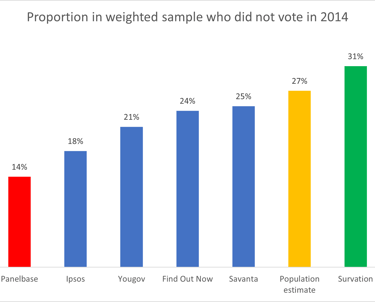
Over time, as new voters enter the electorate, the proportion of those who voted in the 2014 referendum will decline, and the proportion of new voters will increase. The latest available population estimates for Scotland were issued in January 2023 and show that there are around 576,000 people aged 16 to 25 who were too young to vote in 2014. Of the remainder we know that the turnout was 84.6%. So, it's relatively easy to calculate the % of the electorate that did not vote in 2014. We need to add the 576,000 new voters to the 15.4% of the 26+ electorate who did not vote (565,000) giving us a total of 1,141,000; equivalent to 27% of the electorate. This would seem to be an obvious starting point for weighting on 2014 vote, yet across the six major pollsters who have published an Indyref poll in the last two months, the figures used for this part of the electorate ranged from just 14% (Panelbase) to 31% (Survation). Savanta and Find Out Now managed to get fairly close.
Getting this bit wrong means most polls overweight for those who voted in 2014. So, across these six pollsters the No vote weight ranged from 38% (Survation) to 48% (Panelbase). And the Yes % ranged from 31% (Survation) to 40% (Ipsos Mori). Survation seem to have difficulty in finding No voters in their samples. Despite the 55 to 45 advantage in 2014, Survation hasn't had a polling sample with more No voters than Yes voters since December 2019. In its recent June 2023 poll the unweighted sample comprised 727 Yes voters and 679 No voters. So, to match the 2014 proportion, they have to apply weights to get the desired proportion. To get the desired Yes weighted total of 628, they apply a weight of 0.81 to all those in the sample that voted Yes. And for No voters, they apply a weight of 1.14 to reach a desired sample of 777.
The last part of the polling method is turnout adjustment based on likelihood to vote. Again, this shouldn't be too difficult to model, as we know that 84.6% of the electorate voted in 2014, and could assume that a similar proportion would vote in any subsequent referendum. But pollsters like to do things their own way, and the approaches range from no adjustment at all for likelihood to vote (Yougov) to including only those 9 to 10 certain to vote on a 1 to 10 scale (Ipsos). Other pollsters use 8 to 10 (Panelbase and Find Out Now) and 6 to 10 (Savanta). Both Survation and Redfield and Wilton use a more nuanced weighting scale based on likelihood to vote, with greater weighting applied to those most likely to vote. This gives turnout ranges from 83% (Find Out Now) through to 96% (Yougov). Ipsos and Panelbase both come pretty close to the actual turnout figure at 85% and 84% respectively.
So, in summary, each poll needs to be seen in context of:
It's sample size (and margin of error)
Polling method
Weighting approach and weights used
Approach to turnout adjustment