Rating the Pollsters
Comparing poll quality: an attempt at Objectivity
Denis Donoghue
3/11/20266 min read


We frequently see polls from a wide range of pollsters with wildly different takes on the question of Scottish Independence. The variations in method and result mean that each side picks its own favourite, and that methodological flaws get overlooked if the results back your position. But it shouldn’t be like that. In most areas of statistics there are very strict and thorough rules that apply to any published dataset which give users the confidence that the findings are robust. For example, the Office for National Statistics follows a clear Code of Practice, which:
“ensure data consistency, integrity, and transparency through harmonised definitions, robust methodology, and clear, accessible, and timely publication of official statistics.”
They cover issues like:
Harmonisation: ensuring agreed definitions to describe data using clear definitions that allow comparison between datasets.
Data standards: rules for describing data, recording, sharing, formatting and managing data.
Quality: focusing on relevance, accuracy, timeliness, clarity and coherence.
Official Statistics are regulated by an independent organisation called the Office for Statistics Regulation which provide a quality standard indicating which statistics meet the standard for Official Statistics. In short, Official Statistics are high quality and regulated.
So how do political polls compare? What quality standards do they adhere to, and are they regulated?
The main regulator of polling in the UK, is the British Polling Council, which is a membership organisation comprising polling companies. Its requirements for member organisations are fairly light, focusing on disclosure of information about the poll rather than specifically around quality. The assumption is that polling companies provide the data and it’s up to the consumer to decide whether it’s robust or pure mince.
“The aim is to ensure that anyone can make an informed decision about whether or not to trust the results of a poll.”
Those commissioning or using the poll are free to interpret the poll findings however they see fit.
There is another organisation that provides a degree of quality control over polling companies, which is the Market Research Society (MRS). The MRS provides a code of conduct for member organisations. These requirements focus mostly on the way that polling is conducted and who carries out the work.
“The Code is also intended to reassure the general public and other interested parties that activities undertaken by MRS Members and MRS Accredited Company Partners are carried out in a professional and ethical manner.”
The code of practice ensures that legal, ethical and data protection principles are adhered to by researchers. It also discourages the use of leading and ambiguous questions. It also states that:
“Members must ensure that reports include sufficient information to enable reasonable assessment of the validity of results…
Sufficient information…. Would include reporting sampling characteristics and parameters used when defining samples as representative of segments of the population, such as when reporting Nationally Representative”
Among the polling organisations I looked at, the following are members of the MRS: Ipsos, Yougov, Norstat, Opinium, Savanta and Survation. The only two that are not are Find Out Now and More in Common. Perhaps not surprisingly, both of these pollsters are more opaque than normal in how they explain and present their weighting approaches. And Find Out Now is guilty of asking brazenly leading questions on behalf of the far right.
Comparing polling quality
Increasingly fed up with inaccurate and wildly diverging samples in Independence Polling, I decided to compare the most recent polls carried out by the main pollsters on several objective measures. I looked at:
Demographics: how well does their sample compare to the age profile of Scotland?
Turnout weighting: to what extent does their approach to turnout mirror the reality of the last referendum?
Use of 2014 weighting: whether or not the samples were weighted to reflect the near 12-year-old Independence Referendum.
Demographics
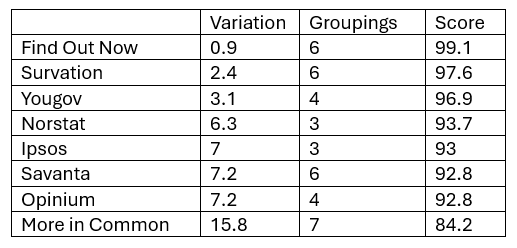
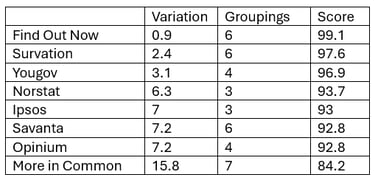
I used as my starting point the most recent (2024) General Registrars Office mid-year population estimates to identify the population within each single age category. I soon realised that pollsters use a wide range of age groupings (no standardisation as with National Statistics) so I had to build up each group based on individual year data. For each grouping I calculated the variance of the sample from the GRO population estimate. So for example, Yougov had 12.2% in the 16 to 24 age category compared with an official estimate of 12.7%. That is a difference of 0.5.
I added up the variations across all age groupings that pollsters used. Age groupings varied from three (Ipsos and Norstat) through to seven (More in Common). Although the age groups varied in make-up, I considered this approach to be robust, because a bigger age grouping would have a larger variance, but this would be offset by there being fewer groups to add up. Using a maximum score of 100 (no variation from National estimates) I gave each pollster a score indexed to that as shown below. The best performer (perhaps surprisingly) was Find Out Now, whose age category samples varied by less than one percentage point. This compared with More in Common, whose age category samples were almost 16 points out.
Turnout weighting
Turnout weighting is almost always used in political polling to reflect the fact that not everybody votes. The theory being that if your overall sample is the whole population, then you need to determine the voting sample from within that. The most straightforward way to do this is to ask respondents how likely they are to vote (usually on a scale of 1 to 10). The turnout for the 2014 independence referendum was 85% and, in the absence of any better information, that would seem to be a sensible figure to aim for.
Again, I looked at the multiple approaches to turnout weighting which ranged from no turnout weighting whatsoever, to a convoluted weighting approach based on likelihood to vote scale. I awarded 100 points for an 85% weighting, and deducted points based on how far away pollsters were.
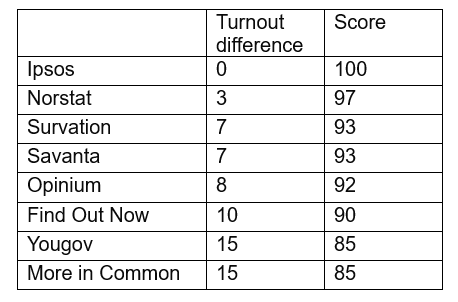
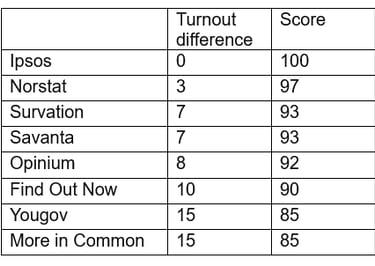
The poorest scoring pollsters (Yougov and More in Common) did not apply any turnout weighting and consequently scored the poorest. Effectively they’re reporting the views of respondents who say they’re 100% not going to vote.
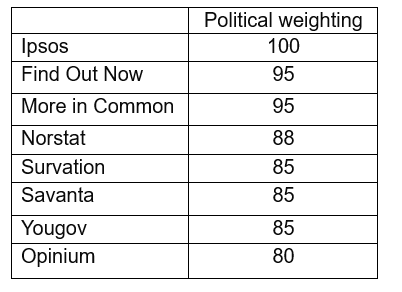
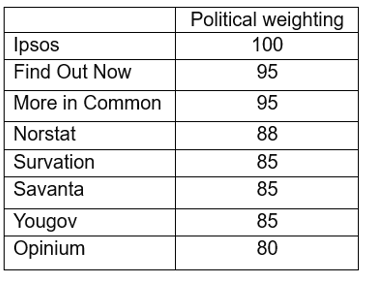
Political weighting
Some form of political weighting of poll samples has become routine. The argument would be that it provides some sort of check that other weighting elements have not resulted in a politically skewed sample. But if you’re going to do it, it makes sense for several reasons, to use relatively recent election results. Not least because respondents find it difficult to remember who they voted for many years ago. That is less of an issue when you consider a referendum; which is a binary issue where most people had fairly strong views; or at the very least a good handle on what they voted for.
But, using the 2014 referendum result to weight polling samples has become increasingly controversial the further away we get from the vote. Given the different (and well researched) age profiles of Yes and No voters the attrition of these groups in the 11 plus years since the vote will be very different. My population modelling suggests that almost two thirds of those who have died since voting in 2014 would be No voters. Using these weightings has the effect of reinstating parity and ignoring the differential death rates over the past decade or so.
Not all pollsters use political weighting. Ipsos has got on perfectly well using a wider range of demographic and socio-economic weights. And the more levels of political weighting that get used the more risk of compounding errors in demographics and vote recall there are. I used a (yes subjective) scale – running from 100 (no pollical weighting) through to 80 points (every possible political weight from 2014, 2016, 2021 and 2024 applied).
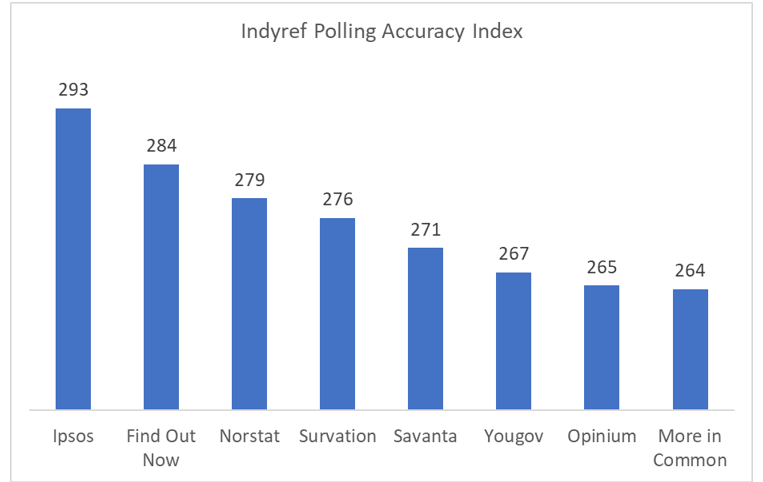
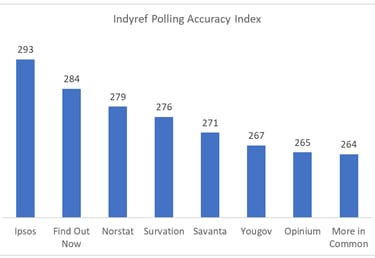
Adding these three scores together gives us an overall picture of the variation in methodology across these pollsters. As the chart below shows, Ipsos comes out on top with 293 out of a possible 300. At the other end of the spectrum, More in Common, Opinium and YouGov all have similar scores of around 265.
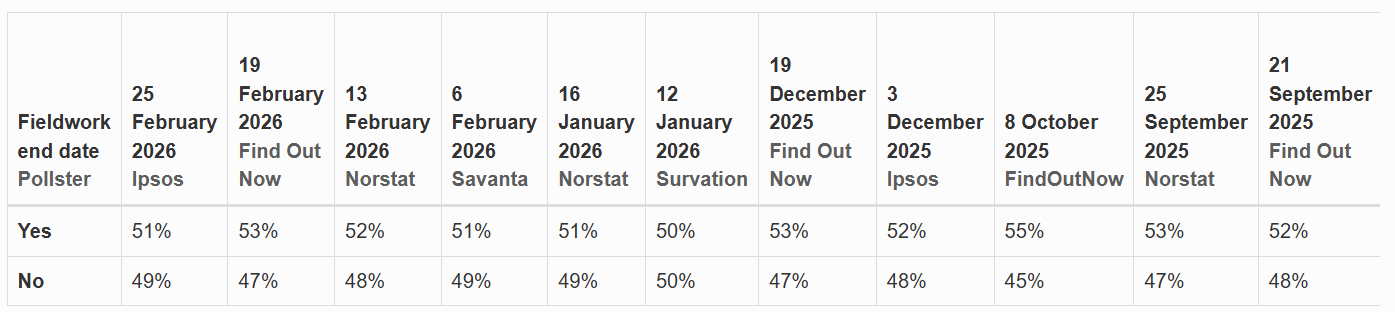
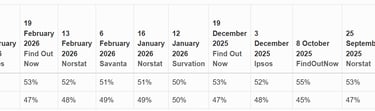
Interestingly if we filter out the lowest-ranked three pollsters on Professor Curtice's What Scotland Thinks database, we have to go back to May 2025 for a poll showing a No lead.
So, when a new poll is published, we shouldn't simply rely on the media to tell us what it says. We need to ask how accurate robust and reliable the sample is, and what is the pollster's track record. Sadly polls on independence tend to generate more questions than they do provide answers.