The Tipping Point
We're at the point where unionists know they can't win an independence referendum.
Denis Donoghue
9/15/20233 min read


You may or may not have read my previous post exploring the differences between using the 2014 referendum result to weight Indyref2 polls and just using wider demographics. This identified differences from two pollsters who had used both approaches, average differences across a range of polls and an analysis of my June Find Out Now poll data.
This post adds further evidence of the changing makeup of the electorate and suggests that time is very much running out for the unionist side if they intend on winning a second referendum. It's becoming pretty obvious why they prefer to block a referendum than persuade Scots of the case for continuing the union. You'll be hard pushed to find any supporter of the union making substantive arguments on its benefits. They rely on two approaches:
Talking Scotland down and characterising it as a charity case needing Westminster to support it.
Telling us we had a referendum in 2014 and we're not getting another one.
Equally they won't look beyond headline data in polls or question the methods being used. When I do so I'm accused of 'making stuff up'. My analysis is all based on published and robust data sources which they can very easily check or challenge. But they never do.
There was an article about my poll in the National by James Kelly which explored some of the issues with polling and the anomalies and 'house effects' with different polling companies. And, while it touched on the issue of using the 2014 result weighting, it didn't quite grasp the real problem. He talked about 'false recall' being an issue with 2014 weighting, rather than the real problem of demographic change. I don't believe false recall is an issue for the 2014 referendum. I mean sure it was a long time ago, but it was a binary question based on a long period of campaigning which divided the nation pretty firmly into two camps. It's not like asking someone what they had for their dinner on their Christmas night out in 2014. People will remember. And, in the unlikely even that they don't, pollsters have an option for recording 'can't remember' (certainly Find Out Now does) and these respondents wouldn't be used in the weighting.
But the issue of demographic change is a problem for 2014 weighting. In short, half a million voters have passed away since 2014, and two thirds of these would have been No voters. That factor alone would have narrowed the gap between Yes and No by three points before we even consider new voters and people changing their minds.
So, alongside the over-representation of No voters in polls weighted by the 2014 vote, the other main factor of difference is the % of the electorate who did not vote in 2014. As I reported previously, polling companies have wildly varying estimates and approaches for this, varying from 14% to 31%. This matters because new voters are much more likely to be Yes supporters. My current estimate is that there are 1.4 million registered voters who did not vote in 2014, representing 27% of the electorate. Looking at the recent trends in Ipsos polls (which don't weight by 2014 vote) you can see both these factors at play.
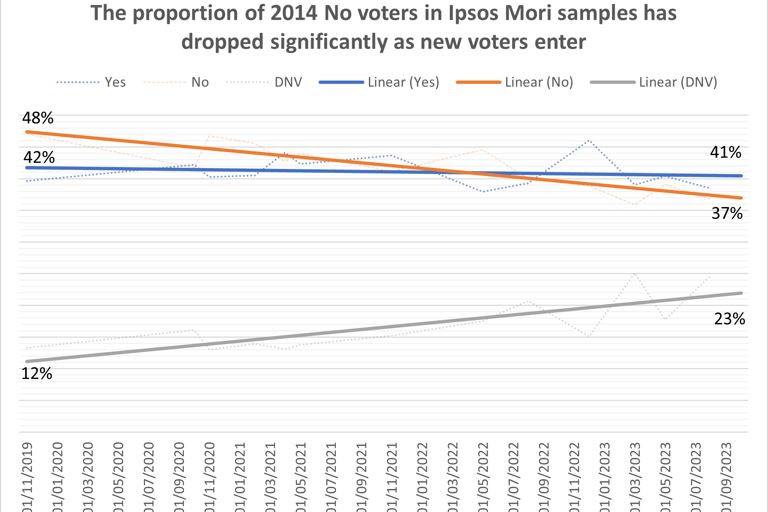
You can see that in the Ipsos samples, the number of Yes voters has actually overtaken the number of No voters, while the proportion of new voters has doubled since 2019. Their latest Political Pulse sample in September 2023 had 25% who didn't vote in 2014; not far off my 27% estimate.
I asked Find Out Now to provide two different samples for my September poll, so that I could see what difference the 2014 weighting would make to the sample. As you can see, it makes quite a significant difference. The proportion of No voters in the sample goes up from 35% to 44% when the 2014 vote weighting is used. And the Yes vote percentage goes down from 40% to 35%.
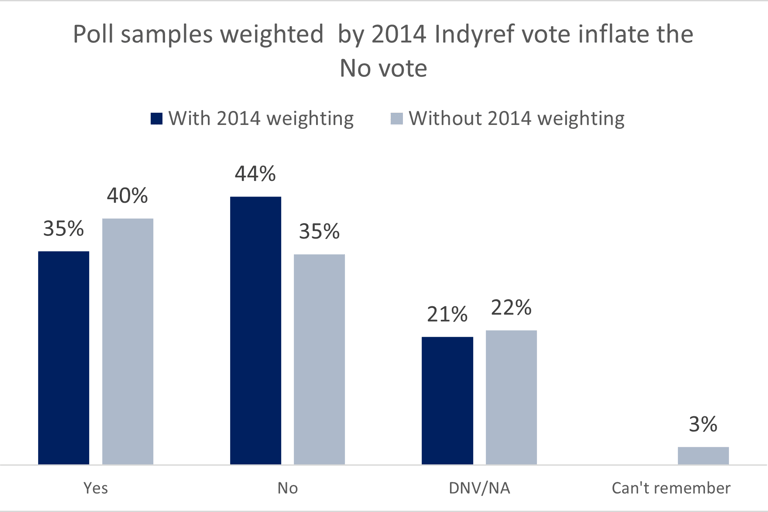

The sample without 2014 weighting is very similar to the Ipsos September sample, and both reflect the greater prevalence of Yes voters, and the higher proportion of those who didn't vote (or who can't remember how they voted). Both of these factors help to bolster the Yes vote shown by polls. And these are not factors that are instigated by 'bias' or cooking the figures; they're simply using sampling methods that provide a more accurate picture of today's electorate.