Who's really ahead?
Analysis of polling approaches on Scottish Independence voting intention
Denis Donoghue
8/16/20235 min read


In a previous post I gave a basic description of how polls work and some of the key factors that influence their accuracy and outcomes. This post builds on that to look at how accurate (or inaccurate) different approaches to weighting polling samples are. One key point of contention relates to whether or not current polls on a second independence referendum should use the 2014 Yes/No split as a basis for weighting. I have looked at this issue using three different approaches, which all suggest that polls using 2014 weighting overstate the support for the unionist (No) side.
The basic premise for this inaccuracy, is the age profile of 2014 voters combined with the passage of time. Studies of the 2014 vote (and subsequent polling) show that older voters were more likely to support the status quo. The Scottish Referendum Study showed that 58.3% of 25 to 34 year olds voted Yes, while among 35 to 44 year olds, 59.2% voted Yes. This compares to only 35.9% of those aged 65 or older. By modelling mortality rates by age group using data from the National Registers of Scotland, we can estimate that of the 512,000 people who've died since 2014, almost two thirds of them would be No voters (64%). This would mean a reduction in the 55.3%/44.7% split of the 2014 vote to 53.8%/46.2%; a narrowing of the gap by three points. So, even before we consider polling approaches and sampling accuracy we can estimate a demographic narrowing effect of three points.
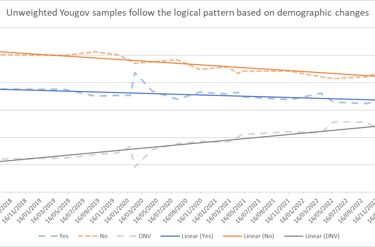
Meanwhile, more new voters enter the electorate with each year that passes, changing the balance of the electorate, and reducing the sway of 2014 voters. My most recent estimate of those who didn't vote in 2014 is around 1.4 million registered voters, making up 27% of the electorate. My modelling of the current makeup of the electorate (based on 2014) is 39% No voters, 34% Yes voters and 27% who did not vote in 2014. This is not hugely different from the unweighted samples in Yougov Indyref2 polls (shown below).

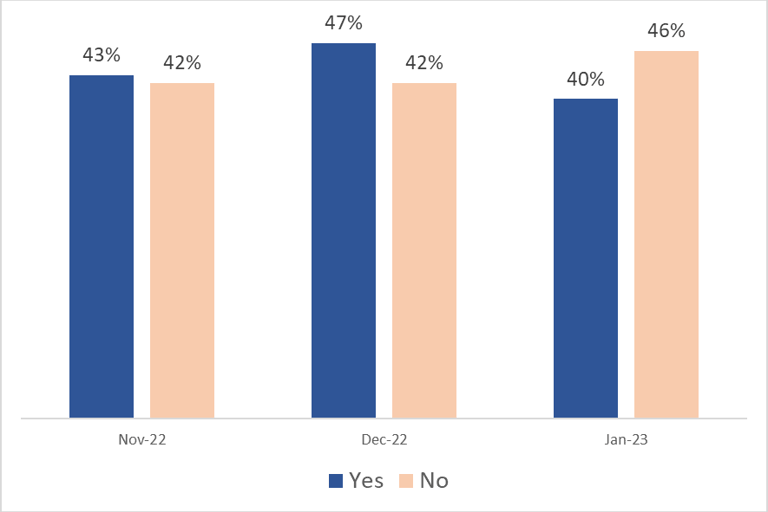
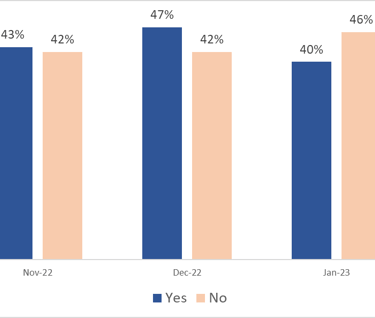
In contrast, the weighted Yougov sample in the Times poll published on August 16th has a split of 44% No voters, 35% Yes voters and 21% who did not vote. The No vote is inflated because they use the 2014 results to weight the sample. This leads to an underestimate of those who did not vote; in this case around six points lower than it should be. That's important because the split in voting intention among new voters heavily favours the pro-independence side; in this case by 48% to 25%. Making that adjustment immediately switches the lead from No to Yes, with Yes on 44%, No on 42% and 14% undecided or refused to say. I'm sure my usual Twitter trolls will just say I'm making up numbers to suit my own agenda. But don't just take my word for it, have a look at what Yougov found when they didn't use 2014 weighting. Their poll in December 2022 for the Times didn't include 2014 weighting (with No vote % in sample dropping from 43.5% to 40%) and showed a surprise five point lead for Yes. You can see how the voting intention compared to the polls from the same company before and after it below.
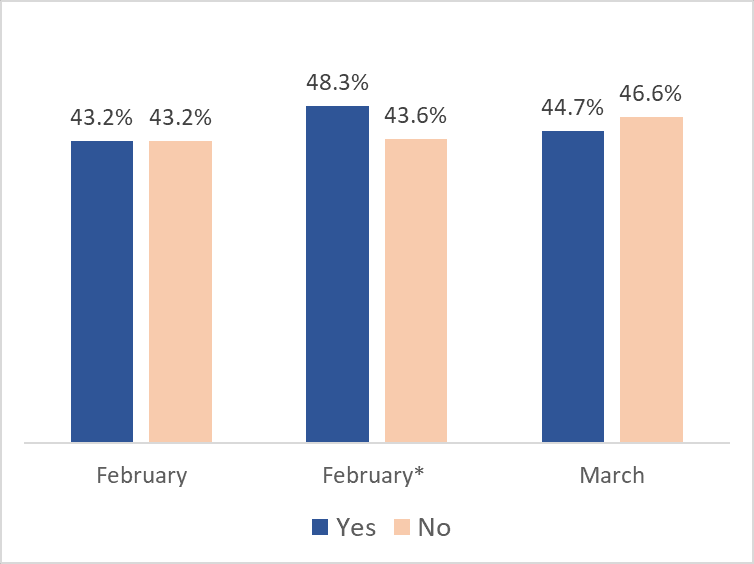
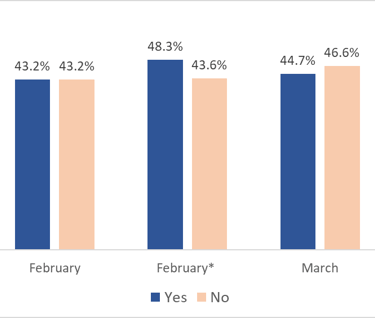
And it's not just Yougov that have used both approaches to weighting. Savanta also carried out an Indyref2 poll that did not weight by 2014 vote, in February 2021. This poll had a very large sample of Yes voters and not surprisingly produced a five point lead for Yes. Again, this was out of line with the polls immediately before and after as shown below.
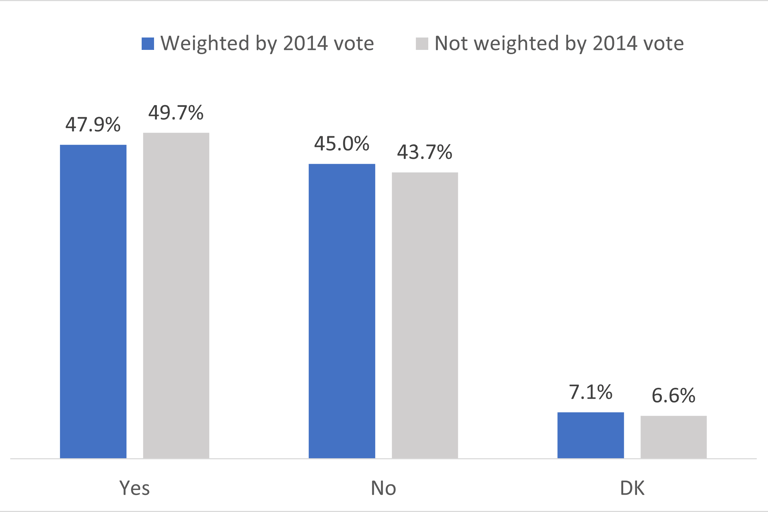
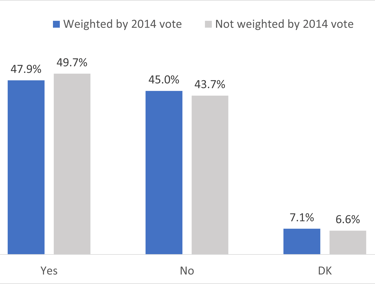
The third pollster who has used both weighting approaches are Find Out Now. I'm fortunate to have a full dataset from the poll I commissioned where the published figures were weighted by 2014 vote. Although previous polls by Find Out Now were not weighted by 2014 vote. Having access to the full data I can test different weighting approaches and look at the effects on the Voting Intention of different weights. In this poll, Yes had a three point lead in the published figures (weighted by 2014 vote) and this lead doubled to six points when we took away the 2014 weighting (as shown below). The difference was not as big as for other pollsters because Find Out Now already had a decent proportion of those who didn't vote in their sample to start with (24%).
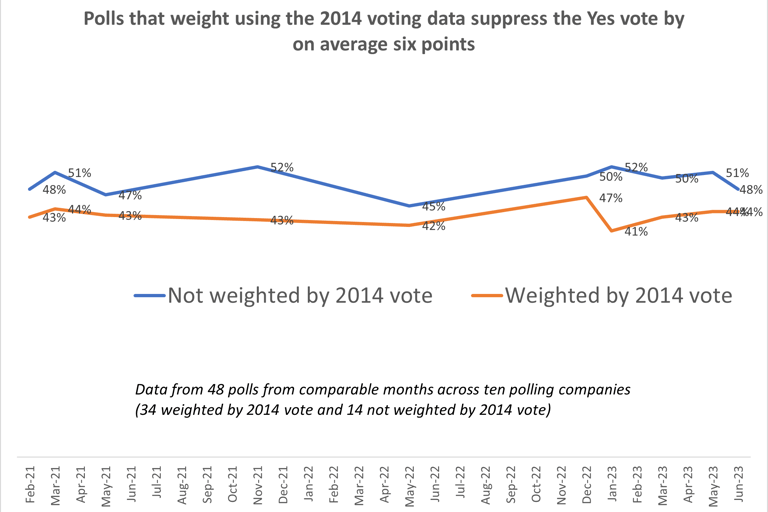
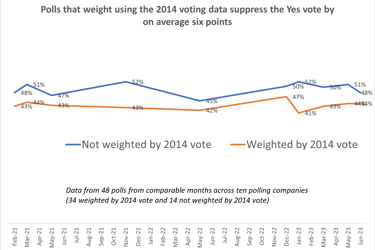
The final way that I looked into this, was to compare the data from polling done from pollsters by both approaches over time. I looked at 48 polls from across ten polling companies and looked at the average Yes and No percentages each month. The polls that don't weight by the 2014 referendum vote are typically higher by between four and eleven points. The average difference is six points.
So, to summarise, many polls overstate the No vote because they inflate the % of No voters in the electorate and understate the number of new voters. The gap between 2014 No voters and 2014 Yes voters has narrowed through natural change by three points. I've looked into how this discrepancy manifests in polls using three approaches.
Direct comparisons of polling by two companies who've used both approaches, which show differentials of 5.7 points (Savanta) and 7.5 points (Yougov) with the polls immediately before and after.
Analysis of my own polling data from Find Out Now looking at the results weighted by 2014 vote, and not weighted by 2014 vote, which shows a differential of 3.1 points .
Aggregation of data from 48 polls looking at the average Yes vote from polls in comparable months, which shows an average differential of 6.2 points.
For many polls, including the most recent Yougov poll, these differences turn small No leads into small Yes leads. It may not seem important, but the narrative can very quickly change when it becomes clear that there is a settled majority for yes that is being routinely under-reported.